|
|
TAG: linear, unlimited, graph, points, regression, colors, , unlimited number, data points, linear regression, non linear, linear regression interpolation, non linear regression, Best Search Category: website design, DVD Cutter, DVD Rip, Easy CD, Convert PDF, Shop Pro, Smart Movie, Recovery, Messenger, Mobile Phone, supernova, music store, dvd video capture, dvd video record, vhs video conversion
License / Price:
Shareware / 50.00 $
|
Category :
Home & Education
/ Math
|
Requirements :
|
Publisher / Limitations:
sales@rt-science.de / 30 Days |
Size / Last Updated:
5.16 MB / 2007-11-19 |
TAG: linear, unlimited, graph, points, regression, colors, ,
unlimited number, data points, linear regression, non linear, linear regression interpolation, non linear regression,
|
Operating System:
Win95, Win98, WinME, WinNT 4.x, Windows2000, WinXP |
Download:
Download
|
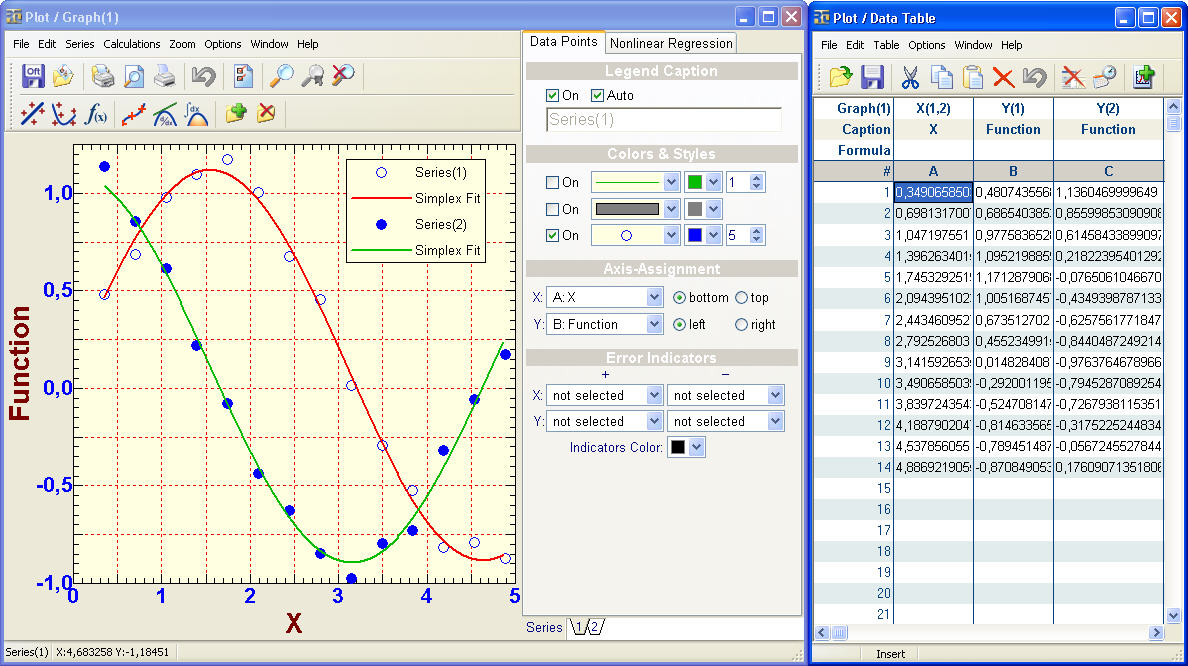
Publisher's description - RtPlot 2.8.10.76
Rt-Plot is a tool to generate Cartesian X/Y-plots from scientific data. You can enter and calculate tabular data. View the changing graphs, including linear and non linear regression, interpolation, differentiation and integration, during entering. Rt-Plot enables you to create plots fast and easily. The line calculations give full access to calculation and display ranges and can use statistical weights. The options can be changed interactively. A powerful reporting module generates ready to publish documents. The result on the screen is the same as on the report printout (what you see is what you get). Although the program looks simple, the graph can be altered in any item you can imagine. All distances in axis, scaling, numberings, captions colors, line- and point styles and colors can be altered. Thus a plot can be generated fitting the requirements of any journal you want to publish in and of cause your personal taste. Features: unlimited number of data points, live calculated data points in data table, unlimited number of graphs, unlimited number of series in graph, unlimited number of calculated lines, linear regression, polynomial, non linear regression,interpolation, smoothing, differential, integral, calculations can use statistical weights, error indicators at data points, function interpreter for calculating columns and non linear functions, graph fully customizable, secondary axis at top and right, twisted, log, exponential axis scaling, all distances colors styles can be varied, report fully customizable, built in word processor, including graph and results.
|
Previous Versions Rt-Plot
RtPlot 2.8.10.76
Also see ...
...in Home & Education  1)
LingvoSoft FlashCards German <> French for Pocket PC 1.3.20
1)
LingvoSoft FlashCards German <> French for Pocket PC 1.3.20
...
2)
Stackz Standard Edition
The Stackz flashcard visualization concept helps to keep the overview over a large amount of words to be learned by representing your current proficiency state with one intuitive view using piles of colored flashcards. The cards are distributed according to the 'mastery level' and colored according to the 'date of the last mastery' - they become darker over time. Thich system allows to distinguish easy cards from difficult ones immediately, and simultaneously seeing which cards must be refreshed...
|
...in Math
1)
Pizza Party Puzzles
Middle-School (grades 5 through 9) math program written to provide skills in context. Students use hints to find what fraction of a pizza was eaten by each of five party-goers. Sample hints: "Judy had 2/5 of a pizza. Bill ate twice as much pizza as Judy."...
2)
Writing Numbers Part 2
Middle-School (grades 5 through 9) math program written to provide skills in context. Given the English language version of a number (e.g. one thousand sixty-five and nine tenths) students must type in the numeral (e.g. 1065.9)....
|
|
Related tags:
|
|